之前已经:
【已解决】使用react-hot-boilerplate去集成ReactJS-AdminLTE
虽然有点其他不完美,但是是可以正常调试了。
现在去尝试把ECharts集成到ReactJS-AdminLTE中
react js echarts
luqin/react-echarts: React ECharts
react中使用echarts就这么简单 – 前端架构经验分享 – SegmentFault
一个简单的 echarts react 封装——echarts-for-react – CNode技术社区
在react中使用echarts · jingchenxu-s-blog
Scatterplot example using React + ECharts
reactjs+echarts实现绘图 – 那些年写过的代码 – CSDN博客
➜ react-hot-boilerplate git:(master) ✗ npm install –save echarts-for-react npm WARN react-dom@15.6.1 requires a peer of react@^15.6.1 but none was installed. added 4 packages in 7.937s |
代码:
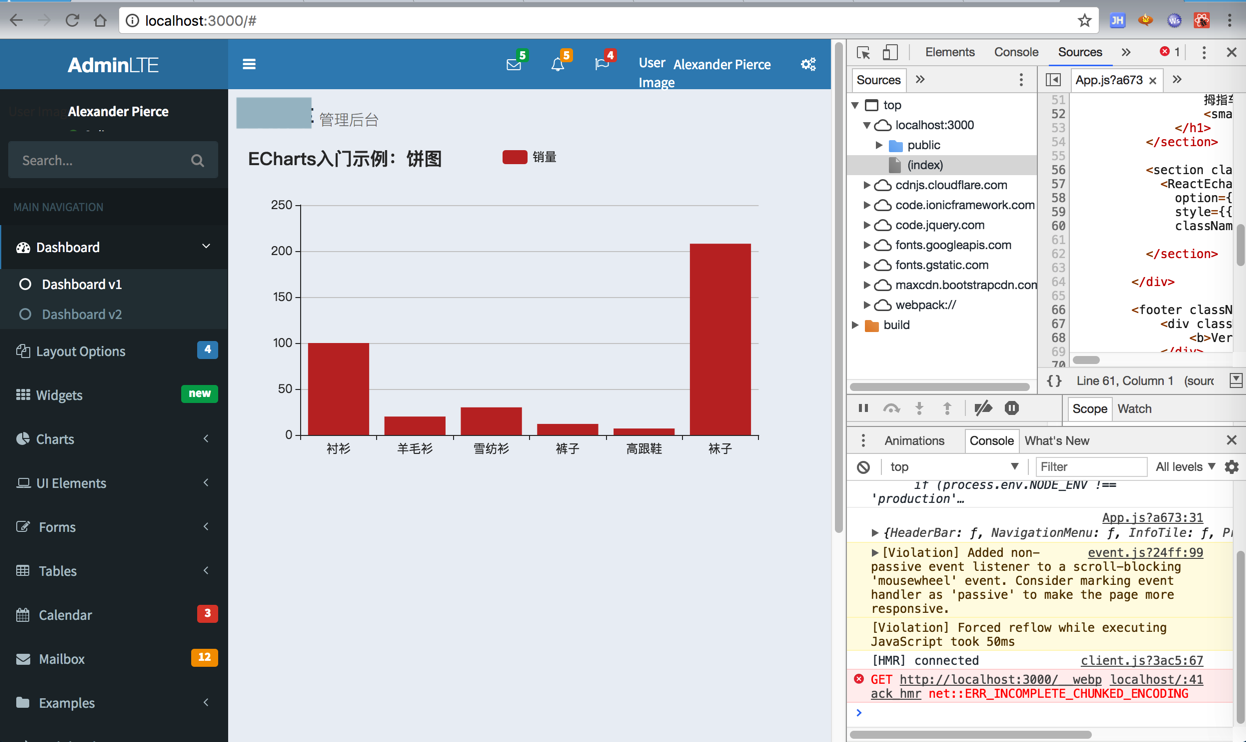
getOption() { const option = { title: { text: ‘ECharts入门示例:饼图’ }, tooltip: {}, legend: { data:[‘销量’] }, xAxis: { data: ["衬衫","羊毛衫","雪纺衫","裤子","高跟鞋","袜子"] }, yAxis: {}, series: [{ name: ‘销量’, type: ‘bar’, data: [100,20,30,12,7,208] }] }; return option; } <section className="content"> <ReactEcharts option={this.getOption()} style={{height: ‘350px’, width: ‘100%’}} className=’react_for_echarts’ /> </section> |
效果:

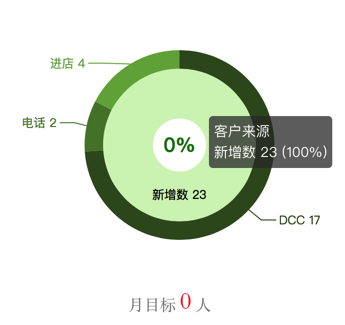
然后再去试试,实现类似于这种的效果:

多层饼图
多层圆环的饼图
echarts 多层饼图
-》
http://echarts.baidu.com/examples.html#chart-type-pie
然后去找到官网的参数的文档:
然后想办法去添加css去控制样式,结果:
【已解决】ECharts如何实现饼图中只有一个百分比的数字的时候居中显示且tooltip和其他环不一样
【总结】
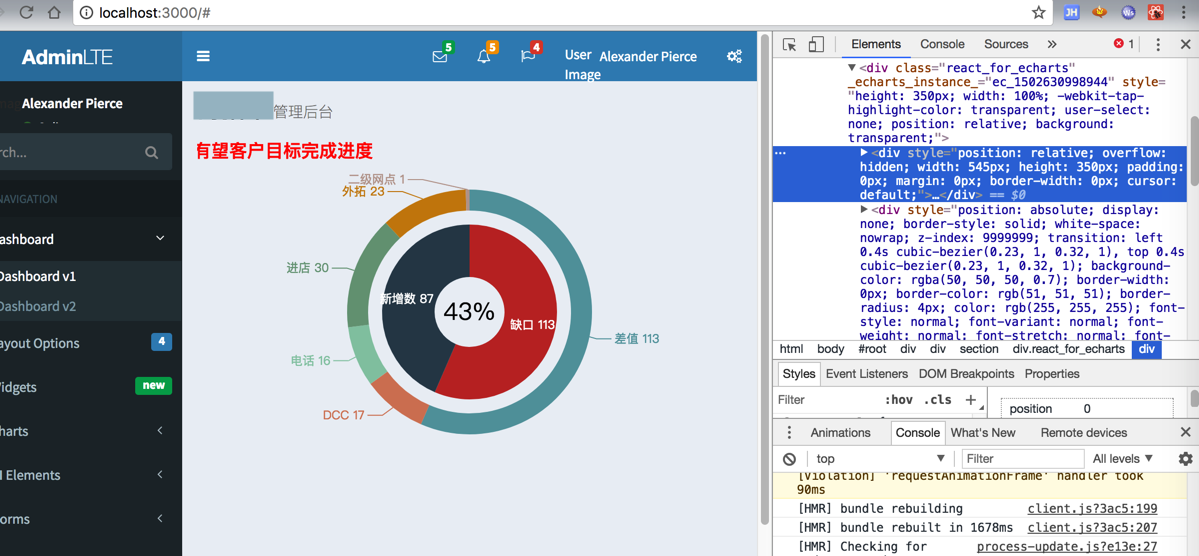
目前已经实现了ReactJS-AdminLTE中添加ECharts的多层饼图==嵌套环形图了:
先去安装ECharts:
npm install –save echarts-for-react |
代码:
import ReactEcharts from ‘echarts-for-react’; //import ‘./app.css’; export default class App extends Component { getProspectOption() { const option = { title: { text: ‘有望监控:本月新增有望客户目标完成进度’, // text: ‘有望客户’, // textAlign: ‘left’, // textAlign: ‘center’, // textAlign: ‘right’, // textBaseline: ‘middle’, // padding: 1, // left: 10, textStyle: { color: ‘red’ } }, tooltip: { trigger: ‘item’, formatter: ‘{a} <br/>{b}: {c}<br/>百分比:{d}%’ }, // legend: { // orient: ‘vertical’, // x: ‘left’, // data:[‘差值’, ‘DCC’,’电话’,’进店’,’外拓’,’二级网点’] // }, series: [ { name:’43%’, type:’pie’, selectedMode: ‘single’, radius: [‘0%’, ‘20%’], // labelLine :{show:true}, label: { normal: { position: ‘center’, // formatter: ‘{a}/{b}/{c}/{d}%’ formatter: ‘{a}’, textStyle: { color: ‘#000000’, fontSize: 24 } }, emphasis:{ position: ‘center’, // formatter: ‘{a}/{b}/{c}/{d}%’ formatter: ‘{a}’, textStyle: { color: ‘#000000’, fontSize: 24 } } }, itemStyle: { normal: { color: ‘#ECF0F5’ } }, data:[ { value: 83/200, name:’新增百分比’ // selected:true } ] }, { name:’访问来源’, type:’pie’, selectedMode: ‘single’, radius: [‘20%’, ‘50%’], label: { normal: { position: ‘inner’, // formatter: ‘{a}/{b}/{c}/{d}%’ formatter: ‘{b} {c}’ } }, labelLine: { normal: { show: true } }, data:[ // {value:113, name:’缺口’, selected:true}, {value:113, name:’缺口’}, {value:87, name:’新增数’} ] }, { name:’访问来源’, type:’pie’, radius: [‘58%’, ‘70%’], label: { normal: { // position: ‘inner’, // formatter: ‘{a}/{b}/{c}/{d}%’ formatter: ‘{b} {c}’ } }, labelLine : { normal : { length : 10, length2 : 15 } }, data:[ {value:113, name:’差值’}, {value:17, name:’DCC’}, {value:16, name:’电话’}, {value:30, name:’进店’}, {value:23, name:’外拓’}, {value:1, name:’二级网点’} ] } ] }; return option; } render() { return ( <div className="wrapper"> <HeaderBar /> <NavigationMenu /> <div className="content-wrapper"> … <section className="content"> {/* <div className={style.prospect_object}>有望监控:本月新增有望客户目标完成进度</div> */} {/* <div className="prospect_object">有望监控:本月新增有望客户目标完成进度</div> */} <ReactEcharts option={this.getProspectOption()} style={{height: ‘350px’, width: ‘100%’}} className=’react_for_echarts’ /> </section> </div> |
效果:

注:
其中此处的option中的title的配置有bug:
text都没有显示完整,
且如果设置textAlign为center,显示出来的内容更少
-》感觉是左边内容被挡住了很多。抽空再去看看如何规避这个bug。
说明:
1.关于echart的更多option的示例代码,可以参考官网:
-》点击进去后,可以进入对应的示例,比如:
2.关于具体参数的含义,可以参考官网文档: